Generating vessels from a dataset#
In this example we will discuss how to generate vessels from existing dataset in OpenTNSim and how to analyse specific locking output.
We take the following steps:
1. Imports#
We start with importing the required libraries
# package(s) related to time, space and id
import datetime, time
import platform
import random
import os
import pathlib
import warnings

# you need these dependencies (you can get these from anaconda)
# package(s) related to the simulation
import simpy

# spatial libraries
import pyproj
import shapely.geometry
from simplekml import Kml, Style

# package(s) for data handling
import pandas as pd
import numpy as np
import matplotlib.pyplot as plt
import matplotlib.animation as animation

# OpenTNSIM
import opentnsim
import opentnsim.core as core
import opentnsim.graph_module as graph_module
import opentnsim.plot as plot
import opentnsim.model as model

# Used for mathematical functions
import math

# Used for making the graph to visualize our problem
import networkx as nx

from shapely.errors import ShapelyDeprecationWarning
warnings.filterwarnings("ignore", category=ShapelyDeprecationWarning)
# Graph location
src_dir = pathlib.Path(opentnsim.__file__).parent.parent

# Graph location
location_graph = src_dir / "notebooks"
name_graph = location_graph / "Shape-Files" / "Rotterdam-Antwerpen-corridor" / "edges_2.shp"

# Vessel database
location_vessel_database = location_graph / "Vessels" / "richtlijnen-vaarwegen-2017.csv"

print('This notebook has been tested with OpenTNSim version {}'.format(opentnsim.__version__))
This notebook has been tested with OpenTNSim version 1.3.7
2. Create vessel#
The following section shows how to use the file richtlijnen-vaarwegen-2017.csv as a database for generating vessels. Inspect the file be opening it in excel to get a feel for how these datasets are structured and how you can use pandas to process this data.
#Load in the data
vessel_db = pd.read_csv(location_vessel_database)
vessel_db['v'] = 1
vessel_db['B'] = vessel_db['width']
vessel_db['type'] = vessel_db['vessel_type']
vessel_db['L'] = vessel_db['length']
vessel_db.head()
| vessel_id | vessel_type | width | length | height_empty | height_full | draught_empty | draught_full | capacity | installed_power | v | B | type | L | |
|---|---|---|---|---|---|---|---|---|---|---|---|---|---|---|
| 0 | 12ad8a02-4aef-11e9-9940-b469212bff5b | CEMT - I | 5.05 | 38.5 | 4.65 | 3.35 | 1.2 | 2.5 | 365 | 175 | 1 | 5.05 | CEMT - I | 38.5 |
| 1 | 17746aee-4aef-11e9-8ebf-b469212bff5b | CEMT - II | 6.60 | 55.0 | 5.80 | 4.60 | 1.4 | 2.6 | 615 | 250 | 1 | 6.60 | CEMT - II | 55.0 |
| 2 | 1be5fb2e-4aef-11e9-9bfb-b469212bff5b | CEMT - III | 8.20 | 85.0 | 6.30 | 5.10 | 1.5 | 2.7 | 1250 | 435 | 1 | 8.20 | CEMT - III | 85.0 |
| 3 | 208a5aca-4aef-11e9-b7e9-b469212bff5b | CEMT - IV | 9.50 | 105.0 | 6.70 | 5.30 | 1.6 | 3.0 | 2040 | 690 | 1 | 9.50 | CEMT - IV | 105.0 |
| 4 | 24f93100-4aef-11e9-8ff9-b469212bff5b | CEMT - Va | 11.40 | 135.0 | 7.10 | 5.40 | 1.8 | 3.5 | 3735 | 1425 | 1 | 11.40 | CEMT - Va | 135.0 |
We start with creating a vessel class. We call this class a Vessel, and add a number of OpenTNSim mix-ins to this class. Each mix-in requires certain input parameters.
The following mix-ins are sufficient to create a vessel for our problem:
Identifiable - allows to give the vessel a name and a random ID,
Movable - allows the vessel to move, with a fixed speed, while logging this activity,
Movable in turn relies on the mix-ins: Locatable, Routeable, and Log
VesselProperties - allows to give the vessel specific properties,
HasContainer - allows vessel to have cargo on board,
HasResource - allows vessel to be requested
These mixi-ins and the vessels_db dataframe are then combined in the vessel generator:
# Vessel type
Vessel = type('Vessel',
              (
                  core.Identifiable, core.Movable, core.HasContainer,
                  core.VesselProperties, core.HasResource, core.Routeable,
                  core.ExtraMetadata
              ),
              {})

generator = model.VesselGenerator(Vessel, vessel_db)
3. Create graph#
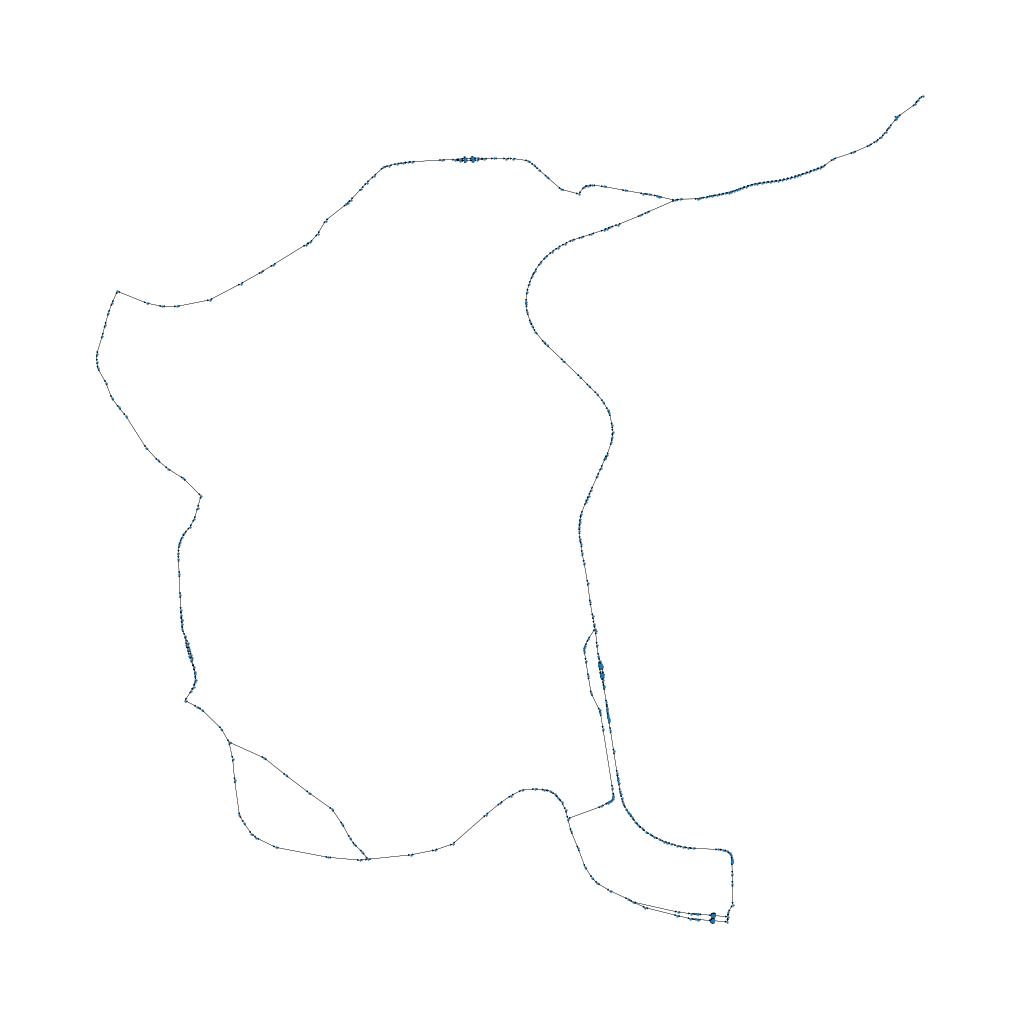
The cel below visualizes the problem. In graph theory the red dots are called edges and the lines are called vertices. Vessels (or any other object) move from edge 1 to edge 3 and from edge 4 to edge 2. The added complexity is that vertice 5-6 only allows traffic in one direction at a time. Vessels can travel simultanously in one direction.
Important:
If you use windows and get the following error “ImportError: read_shp requires OGR: http://www.gdal.org/”, you probably have this issue. Solving it is possible by running the following commands in your terminal (as explained here):
#Create a new virtual environment
conda create -n testgdal -c conda-forge gdal vs2015_runtime=14

#Activate virtual environment
activate testgdal

#Open Jupyter notebook
jupyer notebook
graph = graph_module.Graph()
graph.from_shape(location_graph, name_graph)
/opt/hostedtoolcache/Python/3.13.4/x64/lib/python3.13/site-packages/osgeo/ogr.py:593: FutureWarning:

Neither ogr.UseExceptions() nor ogr.DontUseExceptions() has been explicitly called. In GDAL 4.0, exceptions will be enabled by default.
graph.create_graph_new_projection()
graph.plot()
4. Run simulation#
# Start simpy environment
simulation_start = datetime.datetime.now()
env = simpy.Environment(initial_time = time.mktime(simulation_start.timetuple()))

# Add graph to environment
graph.add_resources(list(graph.graph.edges), np.ones(len(list(graph.graph.edges))), env)
env.FG = graph.graph
def start(env, vessel):
    while True:

        vessel.log_entry_v0("Start sailing", env.now, "0", vessel.geometry)
        yield from vessel.move()
        vessel.log_entry_v0("Stop sailing", env.now, "0", vessel.geometry)

        if vessel.geometry == nx.get_node_attributes(env.FG, "geometry")[vessel.route[-1]]:
            break
vessels = []

# Add 10 vessels to the simulation
for i in range(10):
    random_1 = random.choice(list(graph.graph))
    random_2 = random.choice(list(graph.graph))
    path = nx.dijkstra_path(graph.graph, random_1, random_2)

    vessel = generator.generate(env, "Vessel " + str(i))
    vessel.route = path
    vessel.geometry = nx.get_node_attributes(env.FG, "geometry")[vessel.route[0]]
    vessels.append(vessel)

    # Add the movements of the vessel to the simulation
    env.process(start(env, vessel))
# Run simulation
env.run()
5. Inspect output#
df = pd.DataFrame.from_dict(vessel.log)
df.head()
| Timestamp | |
|---|---|
| 0 | 2025-06-12 14:56:19.000000 |
| 1 | 2025-06-12 14:56:19.000000 |
| 2 | 2025-06-12 15:08:23.196682 |
| 3 | 2025-06-12 15:08:23.196682 |
| 4 | 2025-06-12 15:38:52.008385 |