Visualizing the sailed path#
Imports#
Import the required libraries
# package(s) related to time, space and id

import datetime
import math
import os
import pathlib
import platform
import random
import time
import warnings

import geopandas as gpd

import matplotlib.animation as animation
import matplotlib.pyplot as plt
# Used for making the graph to visualize our problem
import networkx as nx
import numpy as np
# OpenTNSIM
import opentnsim
import opentnsim.core as core
import opentnsim.utils
# package(s) for data handling
import pandas as pd
# spatial libraries
import pyproj
import shapely.geometry
# you need these dependencies (you can get these from anaconda)
# package(s) related to the simulation
import simpy
from shapely.errors import ShapelyDeprecationWarning
from simplekml import Kml, Style

warnings.filterwarnings("ignore", category=ShapelyDeprecationWarning)

print("This notebook has been tested with OpenTNSim version {}".format(opentnsim.__version__))
This notebook has been tested with OpenTNSim version 1.3.7
# Graph location
src_dir = pathlib.Path(opentnsim.__file__).parent.parent

# Graph location
location_graph = src_dir / "notebooks"
name_graph = location_graph / "Shape-Files" / "Rotterdam-Antwerpen-corridor" / "edges_2.shp"
Create graph#
Important:
If you use windows and get the following error “ImportError: read_shp requires OGR: http://www.gdal.org/”, you probably have this issue. Solving it is possible by running the following commands in your terminal (as explained here):
#Create a new virtual environment
conda create -n testgdal -c conda-forge gdal vs2015_runtime=14

#Activate virtual environment
activate testgdal

#Open Jupyter notebook
jupyer notebook
def read_shp(name_graph):
    gdf = gpd.read_file(name_graph)


    def source_target(geom):
        source, *middle, target = geom.coords
        # source = shapely.Point(source).wkt
        # target = shapely.Point(target).wkt
        return pd.Series({"source": source, "target": target})


    nodes = gdf["geometry"].apply(source_target)
    gdf["source"] = nodes["source"]
    gdf["target"] = nodes["target"]
    FG = nx.from_pandas_edgelist(gdf)
    return FG
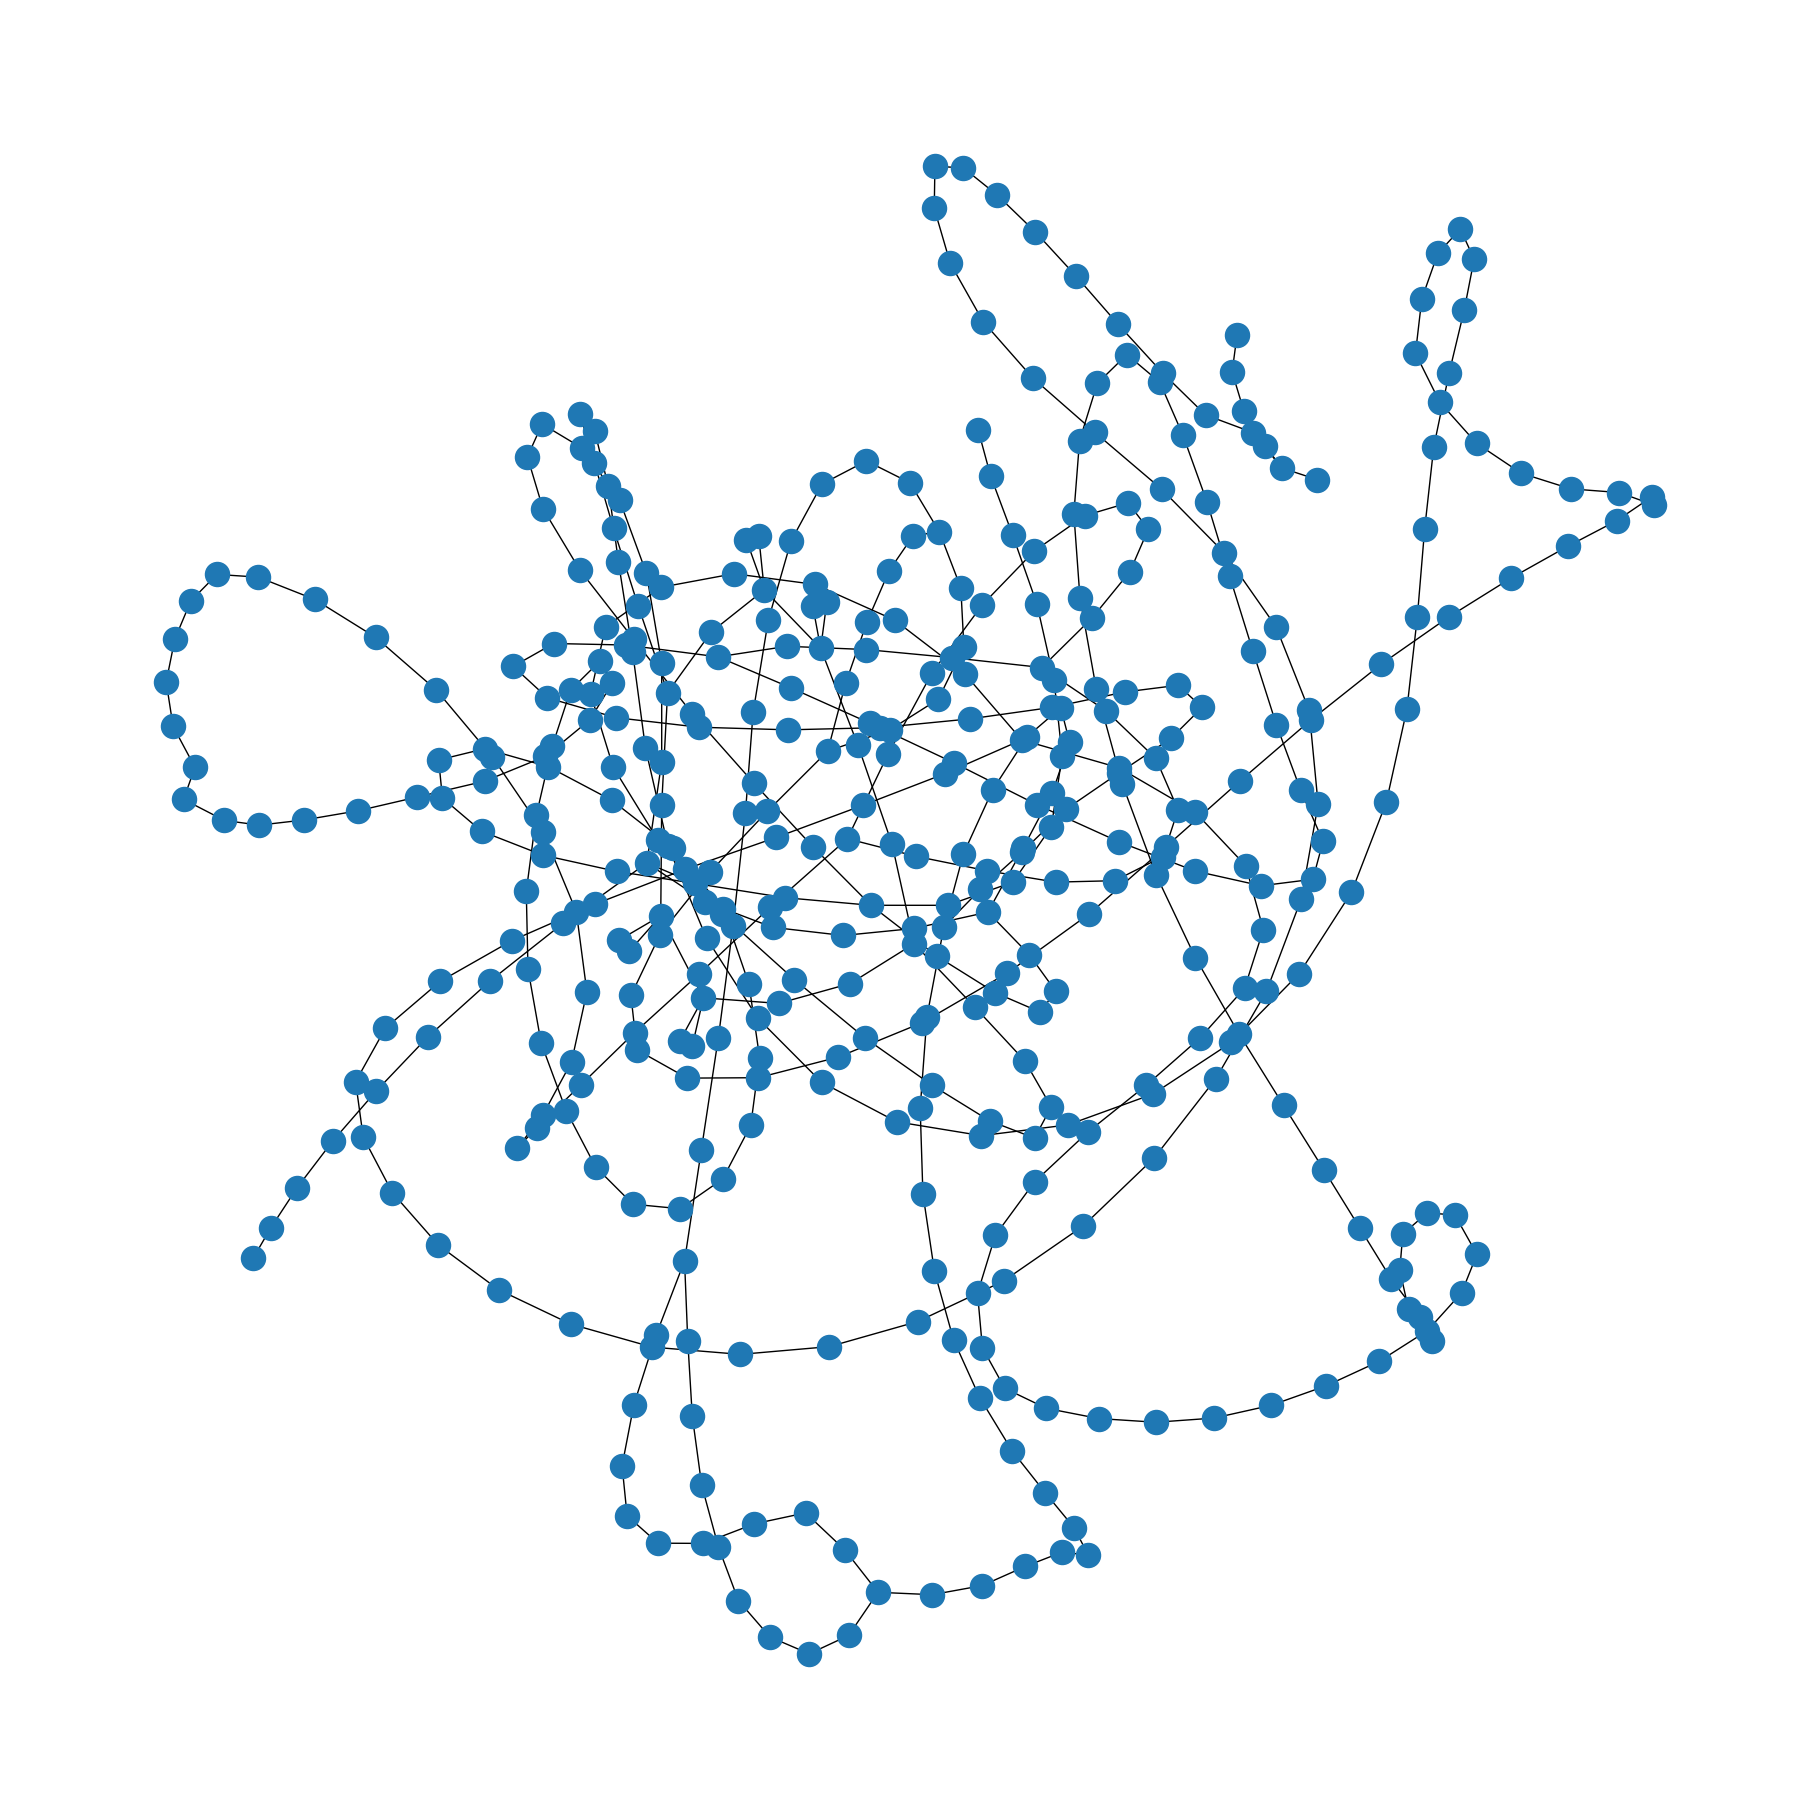
# Read the shape-file
FG = read_shp(name_graph)

# Draw the shape-file to get a first impression
plt.figure(figsize=(18, 18))
nx.draw(FG)

# Show the drawing
plt.show()
# calculate distance between two points
def calculate_distance(orig, dest):
wgs84 = pyproj.Geod(ellps="WGS84")
distance = wgs84.inv(
shapely.geometry.shape(orig).x,
shapely.geometry.shape(orig).y,
shapely.geometry.shape(dest).x,
shapely.geometry.shape(dest).y,
)[2]
return distance
H_G = nx.Graph()
lat_lon_to_index = {}
edge_id_counter = 0
for i, node in enumerate(FG.nodes(data=True)):
H_G.add_node(i, pos=node[0], name="Node {}".format(i), geometry=shapely.geometry.Point(node[0][0], node[0][1]))
lat_lon_to_index[node[0]] = i
for edge in FG.edges(data=True):
H_G.add_edge(
lat_lon_to_index[edge[0]],
lat_lon_to_index[edge[1]],
dis=calculate_distance(
nx.get_node_attributes(H_G, "geometry")[lat_lon_to_index[edge[1]]],
nx.get_node_attributes(H_G, "geometry")[lat_lon_to_index[edge[0]]],
),
)
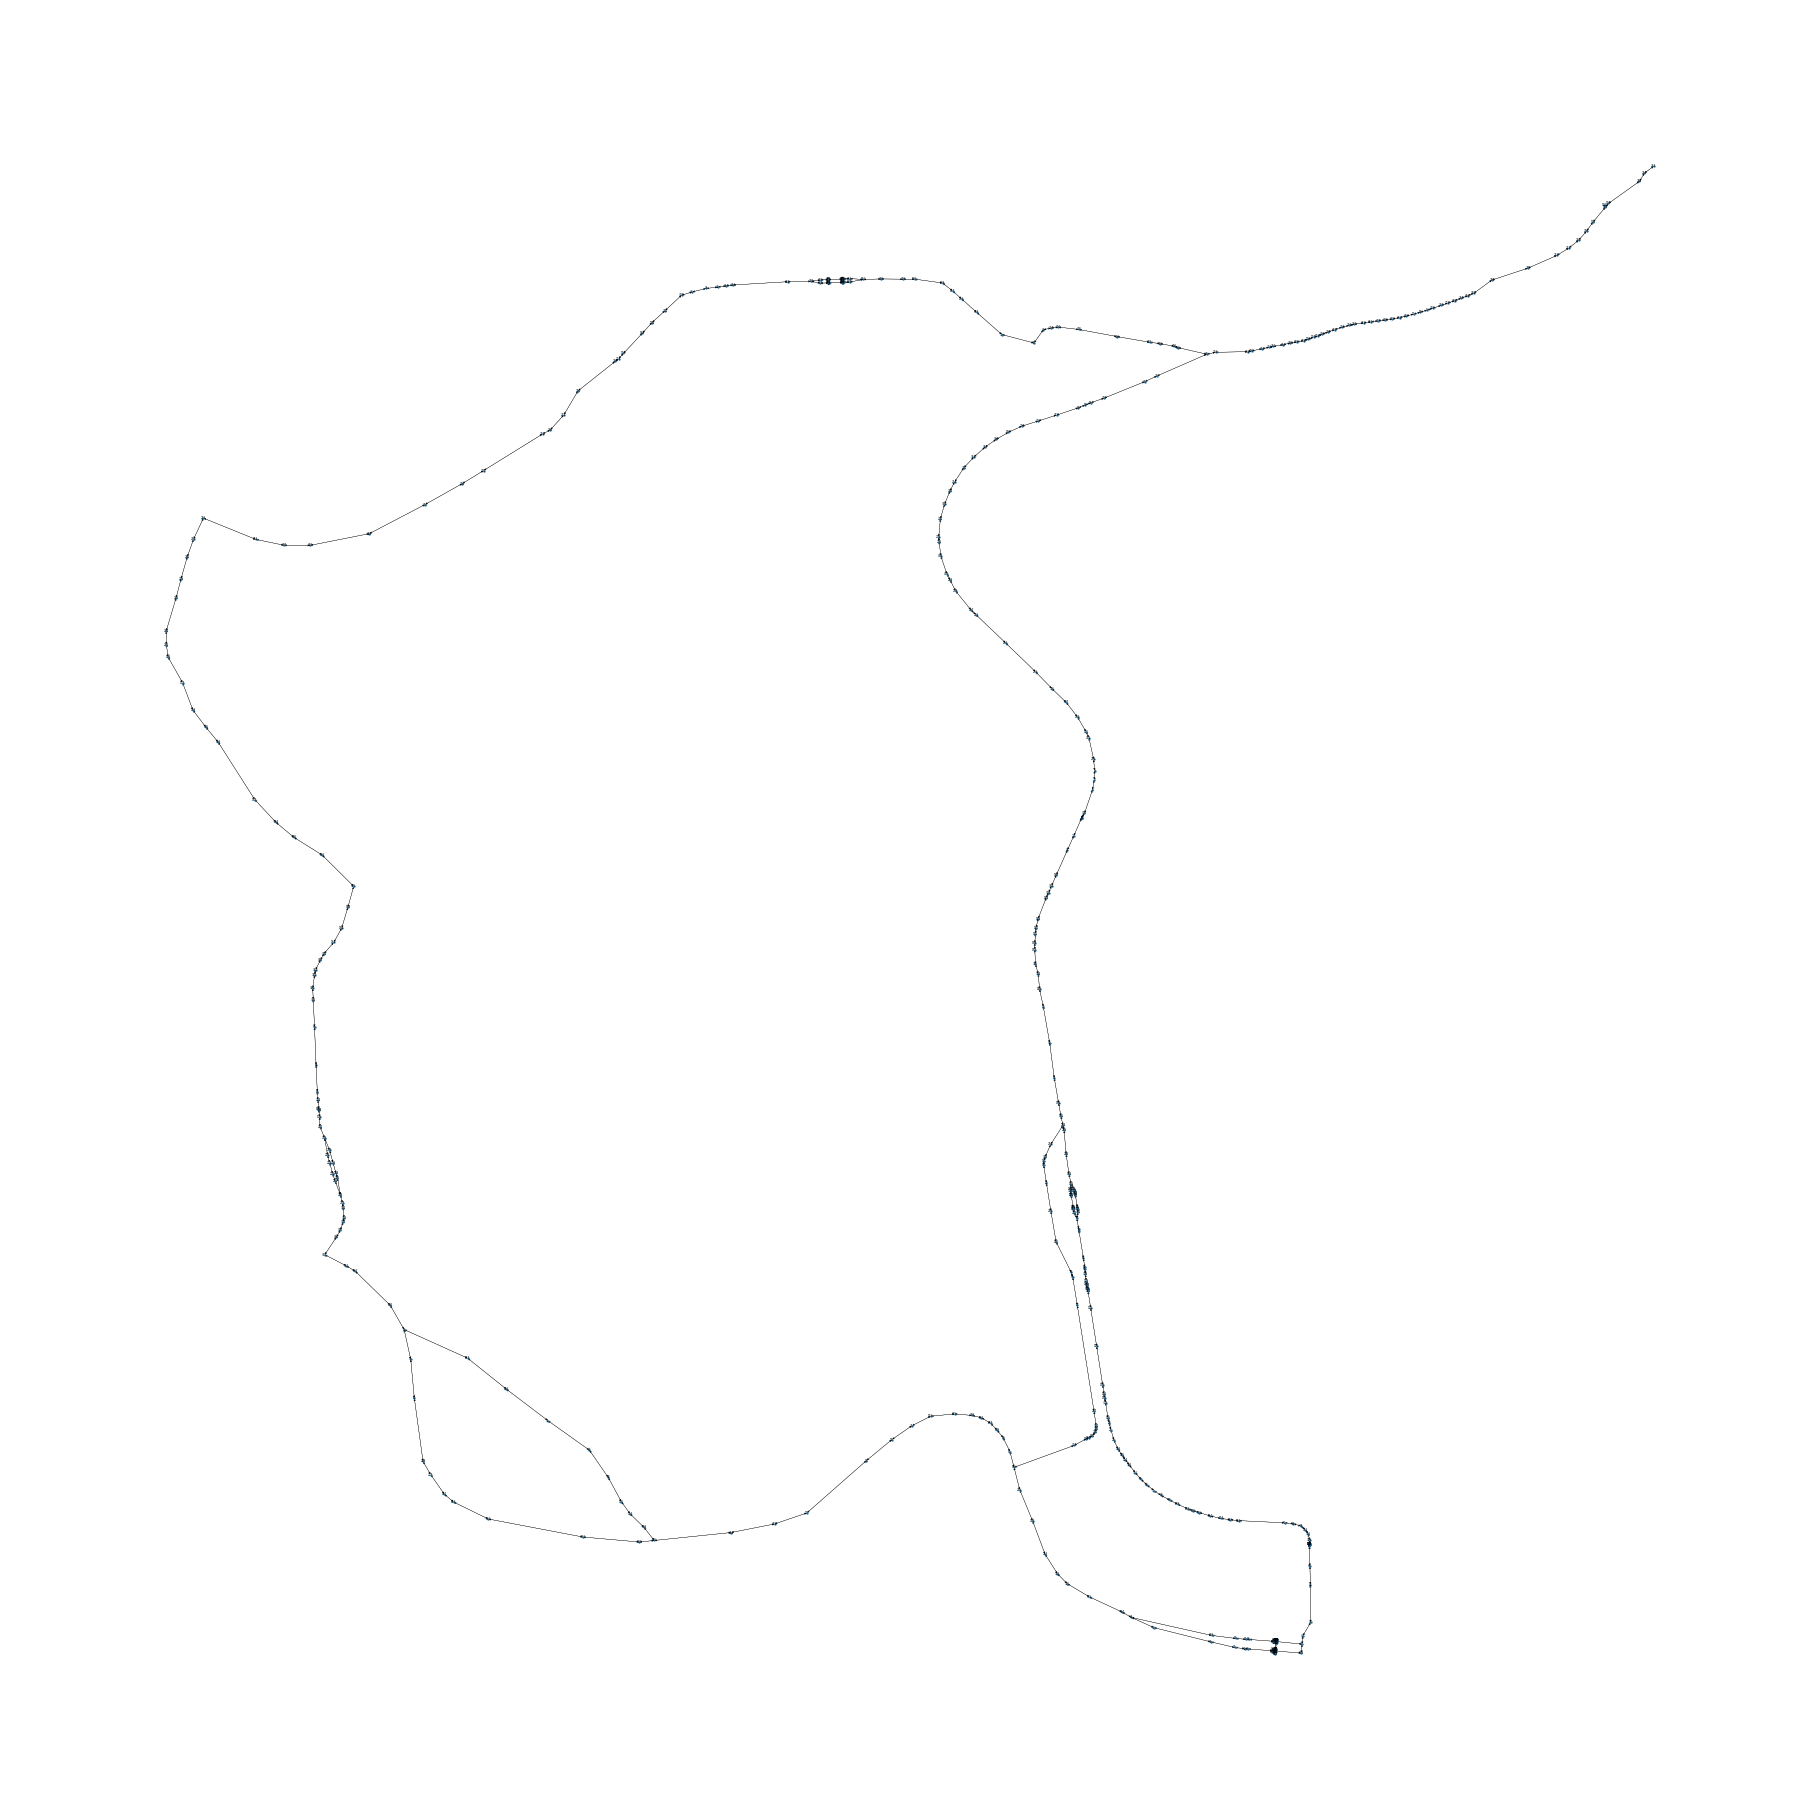
FG = H_G.to_directed()
plt.figure(figsize=(18, 18))
nx.draw(FG, nx.get_node_attributes(FG, "pos"), with_labels=True, node_size=0.5, font_size=2, width=0.2, arrowsize=3)
plt.show()
Create vessels#
Vessel without graph, but with shortest path.
# Make a class out of mix-ins
TransportResource = type(
    "TransportResource", (core.Identifiable, core.Movable, core.HasResource, core.Routable, core.ExtraMetadata), {}
)


# For testing purposes we only want v to be 1
def compute_v_provider(v_empty, v_full):
    return lambda x: 1


data_vessel = {
    "env": None,
    "name": "Vessel number 1",
    "route": None,
    "geometry": shapely.geometry.Point(0, 0),  # lon, lat
    "capacity": 1_000,
    "v": 1,
}

# create the transport processing resource
vessel = TransportResource(**data_vessel)
Define paths#
# First simulation is from random node 1 to random node 2
source = 80
target = 287

path = nx.dijkstra_path(FG, source, target)
Run simulation#
def start(env, vessel):
    while True:
        vessel.log_entry_v0("Start sailing", env.now, "", vessel.geometry)
        yield from vessel.move()
        vessel.log_entry_v0("Stop sailing", env.now, "", vessel.geometry)

        if vessel.geometry == nx.get_node_attributes(FG, "geometry")[vessel.route[-1]]:
            break
# Start simpy environment
simulation_start = datetime.datetime.now()
env = simpy.Environment(initial_time=time.mktime(simulation_start.timetuple()))
env.epoch = time.mktime(simulation_start.timetuple())

# Add graph to environment
env.FG = FG

# Add environment and path to the vessel
vessel.env = env
vessel.route = path
vessel.geometry = nx.get_node_attributes(FG, "geometry")[path[0]]

# Start the simulation
env.process(start(env, vessel))
env.run()

print("Simulation of path {} took {} seconds".format(path, int(env.now)))
Simulation of path [80, 81, 94, 95, 96, 303, 74, 304, 315, 395, 383, 253, 254, 255, 88, 89, 90, 109, 287] took 1749749245 seconds
Obtain vessel log information#
The cel below uses the vessel log. The core function log_entry is used, which takes four arguments:
Log. A text to describe what is logged.
t. The timestamp.
Value. The value for the log (for sailing this is the distance).
Geometry The location of the vessel while loggin.
vessel_log = pd.DataFrame.from_dict(vessel.logbook)
vessel_log.head()
| Message | Timestamp | Value | Geometry | |
|---|---|---|---|---|
| 0 | Start sailing | 2025-06-12 14:55:29.000000 | POINT (4.2898595 51.3462538) | |
| 1 | Sailing from node 80 to node 81 start | 2025-06-12 14:55:29.000000 | 0 | POINT (4.2898595 51.3462538) |
| 2 | Sailing from node 80 to node 81 stop | 2025-06-12 14:55:57.779383 | 0 | POINT (4.2898218 51.3459962) |
| 3 | Sailing from node 81 to node 94 start | 2025-06-12 14:55:57.779383 | 0 | POINT (4.2898218 51.3459962) |
| 4 | Sailing from node 81 to node 94 stop | 2025-06-12 15:04:30.014840 | 0 | POINT (4.2825009 51.3464185) |
Visualization of path#
If you get an error regarding ffmpeg use this answer. You have to install ffmpeg in your Conda environment. It can be done using the following command.
#Install ffmpeg using Conda
conda install -c conda-forge ffmpeg
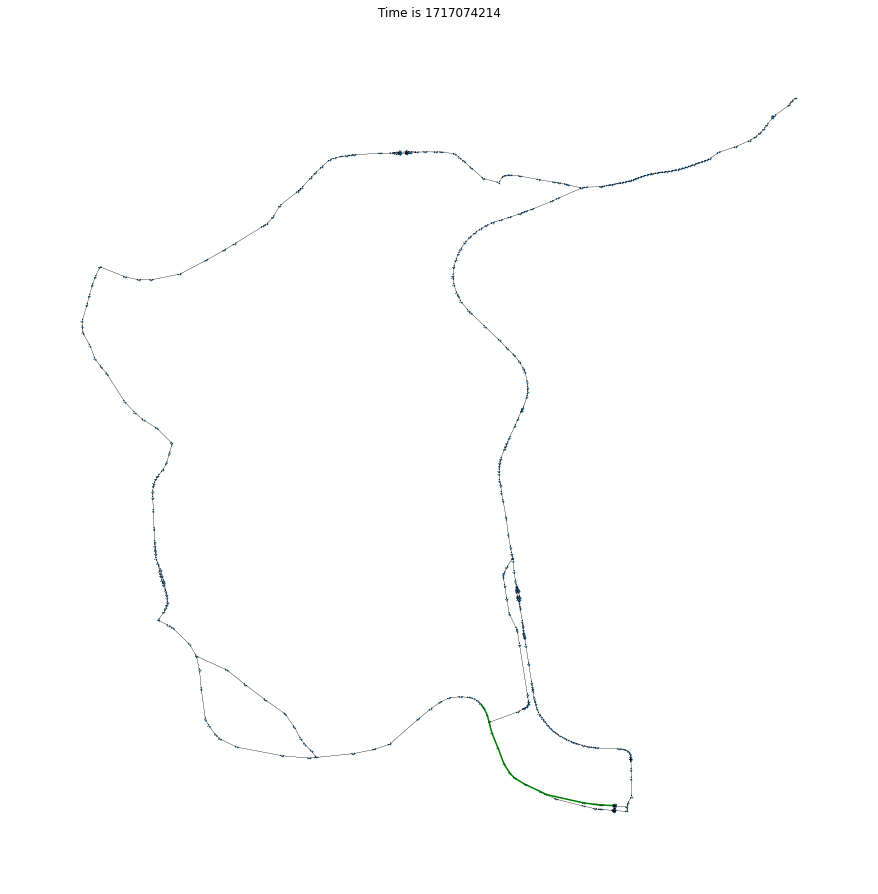
%%time

# Get the coordinates of every step
coordinates = []
for i in vessel_log["Geometry"]:
    coordinates.append((i.x, i.y))

# Get the time of every step
timesteps = []
for i in vessel_log["Timestamp"]:
    timesteps.append(i.timestamp())

# Make the animation
fig = plt.figure(figsize=[12, 12])

nx.draw(FG, nx.get_node_attributes(FG, "pos"), with_labels=True, node_size=0.5, font_size=2, width=0.2, arrowsize=3)

(location,) = plt.plot([], [], "kx", markersize=15)
(path,) = plt.plot([], [], "go", markersize=8)
time_text = plt.title("")


def init():
    location.set_data([], [])
    path.set_data([], [])
    time_text.set_text("Time is 0")


def animate(i):
    this_x = [coordinates[i][0]]
    this_y = [coordinates[i][1]]

    location.set_data(this_x, this_y)
    time_text.set_text("Time is {}".format(int(timesteps[i])))

    if 0 < i:
        past_x = [coordinate[0] for coordinate in coordinates[:i]]
        past_y = [coordinate[1] for coordinate in coordinates[:i]]

        path.set_data(past_x, past_y)

        return location, path, time_text

    else:
        return location, time_text


ani = animation.FuncAnimation(fig, animate, np.arange(0, len(timesteps)), init_func=init)
ani.save("Example 06 - route.mp4", fps=5)
MovieWriter ffmpeg unavailable; using Pillow instead.
---------------------------------------------------------------------------
KeyboardInterrupt                         Traceback (most recent call last)
File /opt/hostedtoolcache/Python/3.13.4/x64/lib/python3.13/site-packages/matplotlib/animation.py:224, in AbstractMovieWriter.saving(self, fig, outfile, dpi, *args, **kwargs)
    223 try:
--> 224     yield self
    225 finally:

File /opt/hostedtoolcache/Python/3.13.4/x64/lib/python3.13/site-packages/matplotlib/animation.py:1122, in Animation.save(self, filename, writer, fps, dpi, codec, bitrate, extra_args, metadata, extra_anim, savefig_kwargs, progress_callback)
   1120 for anim, d in zip(all_anim, data):
   1121     # TODO: See if turning off blit is really necessary
-> 1122     anim._draw_next_frame(d, blit=False)
   1123     if progress_callback is not None:

File /opt/hostedtoolcache/Python/3.13.4/x64/lib/python3.13/site-packages/matplotlib/animation.py:1158, in Animation._draw_next_frame(self, framedata, blit)
   1157 self._draw_frame(framedata)
-> 1158 self._post_draw(framedata, blit)

File /opt/hostedtoolcache/Python/3.13.4/x64/lib/python3.13/site-packages/matplotlib/animation.py:1183, in Animation._post_draw(self, framedata, blit)
   1182 else:
-> 1183     self._fig.canvas.draw_idle()

File /opt/hostedtoolcache/Python/3.13.4/x64/lib/python3.13/site-packages/matplotlib/backend_bases.py:1891, in FigureCanvasBase.draw_idle(self, *args, **kwargs)
   1890 with self._idle_draw_cntx():
-> 1891     self.draw(*args, **kwargs)

File /opt/hostedtoolcache/Python/3.13.4/x64/lib/python3.13/site-packages/matplotlib/backends/backend_agg.py:382, in FigureCanvasAgg.draw(self)
    380 with (self.toolbar._wait_cursor_for_draw_cm() if self.toolbar
    381       else nullcontext()):
--> 382     self.figure.draw(self.renderer)
    383     # A GUI class may be need to update a window using this draw, so
    384     # don't forget to call the superclass.

File /opt/hostedtoolcache/Python/3.13.4/x64/lib/python3.13/site-packages/matplotlib/artist.py:94, in _finalize_rasterization.<locals>.draw_wrapper(artist, renderer, *args, **kwargs)
     92 @wraps(draw)
     93 def draw_wrapper(artist, renderer, *args, **kwargs):
---> 94     result = draw(artist, renderer, *args, **kwargs)
     95     if renderer._rasterizing:

File /opt/hostedtoolcache/Python/3.13.4/x64/lib/python3.13/site-packages/matplotlib/artist.py:71, in allow_rasterization.<locals>.draw_wrapper(artist, renderer)
     69         renderer.start_filter()
---> 71     return draw(artist, renderer)
     72 finally:

File /opt/hostedtoolcache/Python/3.13.4/x64/lib/python3.13/site-packages/matplotlib/figure.py:3257, in Figure.draw(self, renderer)
   3256 self.patch.draw(renderer)
-> 3257 mimage._draw_list_compositing_images(
   3258     renderer, self, artists, self.suppressComposite)
   3260 renderer.close_group('figure')

File /opt/hostedtoolcache/Python/3.13.4/x64/lib/python3.13/site-packages/matplotlib/image.py:134, in _draw_list_compositing_images(renderer, parent, artists, suppress_composite)
    133     for a in artists:
--> 134         a.draw(renderer)
    135 else:
    136     # Composite any adjacent images together

File /opt/hostedtoolcache/Python/3.13.4/x64/lib/python3.13/site-packages/matplotlib/artist.py:71, in allow_rasterization.<locals>.draw_wrapper(artist, renderer)
     69         renderer.start_filter()
---> 71     return draw(artist, renderer)
     72 finally:

File /opt/hostedtoolcache/Python/3.13.4/x64/lib/python3.13/site-packages/matplotlib/axes/_base.py:3216, in _AxesBase.draw(self, renderer)
   3214     _draw_rasterized(self.get_figure(root=True), artists_rasterized, renderer)
-> 3216 mimage._draw_list_compositing_images(
   3217     renderer, self, artists, self.get_figure(root=True).suppressComposite)
   3219 renderer.close_group('axes')

File /opt/hostedtoolcache/Python/3.13.4/x64/lib/python3.13/site-packages/matplotlib/image.py:134, in _draw_list_compositing_images(renderer, parent, artists, suppress_composite)
    133     for a in artists:
--> 134         a.draw(renderer)
    135 else:
    136     # Composite any adjacent images together

File /opt/hostedtoolcache/Python/3.13.4/x64/lib/python3.13/site-packages/matplotlib/artist.py:71, in allow_rasterization.<locals>.draw_wrapper(artist, renderer)
     69         renderer.start_filter()
---> 71     return draw(artist, renderer)
     72 finally:

File /opt/hostedtoolcache/Python/3.13.4/x64/lib/python3.13/site-packages/matplotlib/text.py:808, in Text.draw(self, renderer)
    807         else:
--> 808             textrenderer.draw_text(gc, x, y, clean_line,
    809                                    self._fontproperties, angle,
    810                                    ismath=ismath, mtext=mtext)
    812 gc.restore()

File /opt/hostedtoolcache/Python/3.13.4/x64/lib/python3.13/site-packages/matplotlib/backends/backend_agg.py:193, in RendererAgg.draw_text(self, gc, x, y, s, prop, angle, ismath, mtext)
    192 font.set_text(s, 0, flags=get_hinting_flag())
--> 193 font.draw_glyphs_to_bitmap(
    194     antialiased=gc.get_antialiased())
    195 d = font.get_descent() / 64.0

KeyboardInterrupt:

During handling of the above exception, another exception occurred:

KeyError                                  Traceback (most recent call last)
File /opt/hostedtoolcache/Python/3.13.4/x64/lib/python3.13/site-packages/PIL/Image.py:2538, in Image.save(self, fp, format, **params)
   2537 try:
-> 2538     format = EXTENSION[ext]
   2539 except KeyError as e:

KeyError: '.mp4'

The above exception was the direct cause of the following exception:

ValueError                                Traceback (most recent call last)
File <timed exec>:47

File /opt/hostedtoolcache/Python/3.13.4/x64/lib/python3.13/site-packages/matplotlib/animation.py:1098, in Animation.save(self, filename, writer, fps, dpi, codec, bitrate, extra_args, metadata, extra_anim, savefig_kwargs, progress_callback)
   1093     return a * np.array([r, g, b]) + 1 - a
   1095 # canvas._is_saving = True makes the draw_event animation-starting
   1096 # callback a no-op; canvas.manager = None prevents resizing the GUI
   1097 # widget (both are likewise done in savefig()).
-> 1098 with (writer.saving(self._fig, filename, dpi),
   1099       cbook._setattr_cm(self._fig.canvas, _is_saving=True, manager=None)):
   1100     if not writer._supports_transparency():
   1101         facecolor = savefig_kwargs.get('facecolor',
   1102                                        mpl.rcParams['savefig.facecolor'])

File /opt/hostedtoolcache/Python/3.13.4/x64/lib/python3.13/contextlib.py:162, in _GeneratorContextManager.__exit__(self, typ, value, traceback)
    160     value = typ()
    161 try:
--> 162     self.gen.throw(value)
    163 except StopIteration as exc:
    164     # Suppress StopIteration *unless* it's the same exception that
    165     # was passed to throw().  This prevents a StopIteration
    166     # raised inside the "with" statement from being suppressed.
    167     return exc is not value

File /opt/hostedtoolcache/Python/3.13.4/x64/lib/python3.13/site-packages/matplotlib/animation.py:226, in AbstractMovieWriter.saving(self, fig, outfile, dpi, *args, **kwargs)
    224     yield self
    225 finally:
--> 226     self.finish()

File /opt/hostedtoolcache/Python/3.13.4/x64/lib/python3.13/site-packages/matplotlib/animation.py:506, in PillowWriter.finish(self)
    505 def finish(self):
--> 506     self._frames[0].save(
    507         self.outfile, save_all=True, append_images=self._frames[1:],
    508         duration=int(1000 / self.fps), loop=0)

File /opt/hostedtoolcache/Python/3.13.4/x64/lib/python3.13/site-packages/PIL/Image.py:2541, in Image.save(self, fp, format, **params)
   2539     except KeyError as e:
   2540         msg = f"unknown file extension: {ext}"
-> 2541         raise ValueError(msg) from e
   2543 from . import ImageFile
   2545 # may mutate self!

ValueError: unknown file extension: .mp4
Visualisation improved#
geom_x = []
geom_y = []

for geom in vessel_log["Geometry"]:
    geom_x.append(geom.x)
    geom_y.append(geom.y)

vessel_log["Geometry - x"] = geom_x
vessel_log["Geometry - y"] = geom_y

vessel_log.head()
| Message | Timestamp | Value | Geometry | Geometry - x | Geometry - y | |
|---|---|---|---|---|---|---|
| 0 | Start sailing | 2024-05-30 10:31:38.000000 | POINT (4.2898595 51.3462538) | 4.289860 | 51.346254 | |
| 1 | Sailing from node 80 to node 81 start | 2024-05-30 10:31:38.000000 | 0 | POINT (4.2898595 51.3462538) | 4.289860 | 51.346254 |
| 2 | Sailing from node 80 to node 81 stop | 2024-05-30 10:32:06.779383 | 0 | POINT (4.2898218 51.3459962) | 4.289822 | 51.345996 |
| 3 | Sailing from node 81 to node 94 start | 2024-05-30 10:32:06.779383 | 0 | POINT (4.2898218 51.3459962) | 4.289822 | 51.345996 |
| 4 | Sailing from node 81 to node 94 stop | 2024-05-30 10:40:39.014840 | 0 | POINT (4.2825009 51.3464185) | 4.282501 | 51.346418 |
geom_x = []
geom_y = []

for geom in vessel_log["Geometry"]:
    geom_x.append(geom.x)
    geom_y.append(geom.y)

vessel_log["Geometry - x"] = geom_x
vessel_log["Geometry - y"] = geom_y

time_stamp_min = min(vessel_log["Timestamp"]).timestamp()
time_stamp_max = max(vessel_log["Timestamp"]).timestamp()

steps = int(np.floor((time_stamp_max - time_stamp_min) / 60))
steps = vessel_log.shape[0]
timestamps_t = np.linspace(time_stamp_min, time_stamp_max, steps)

times = []
for t in vessel_log["Timestamp"]:
    times.append(t.timestamp())

vessel_log["timestamps_t"] = timestamps_t
vessel_log["timestamps_x"] = np.interp(timestamps_t, times, vessel_log["Geometry - x"])
vessel_log["timestamps_y"] = np.interp(timestamps_t, times, vessel_log["Geometry - y"])

timestamps_t = vessel_log["timestamps_t"]
timestamps_x = vessel_log["timestamps_x"]
timestamps_y = vessel_log["timestamps_y"]
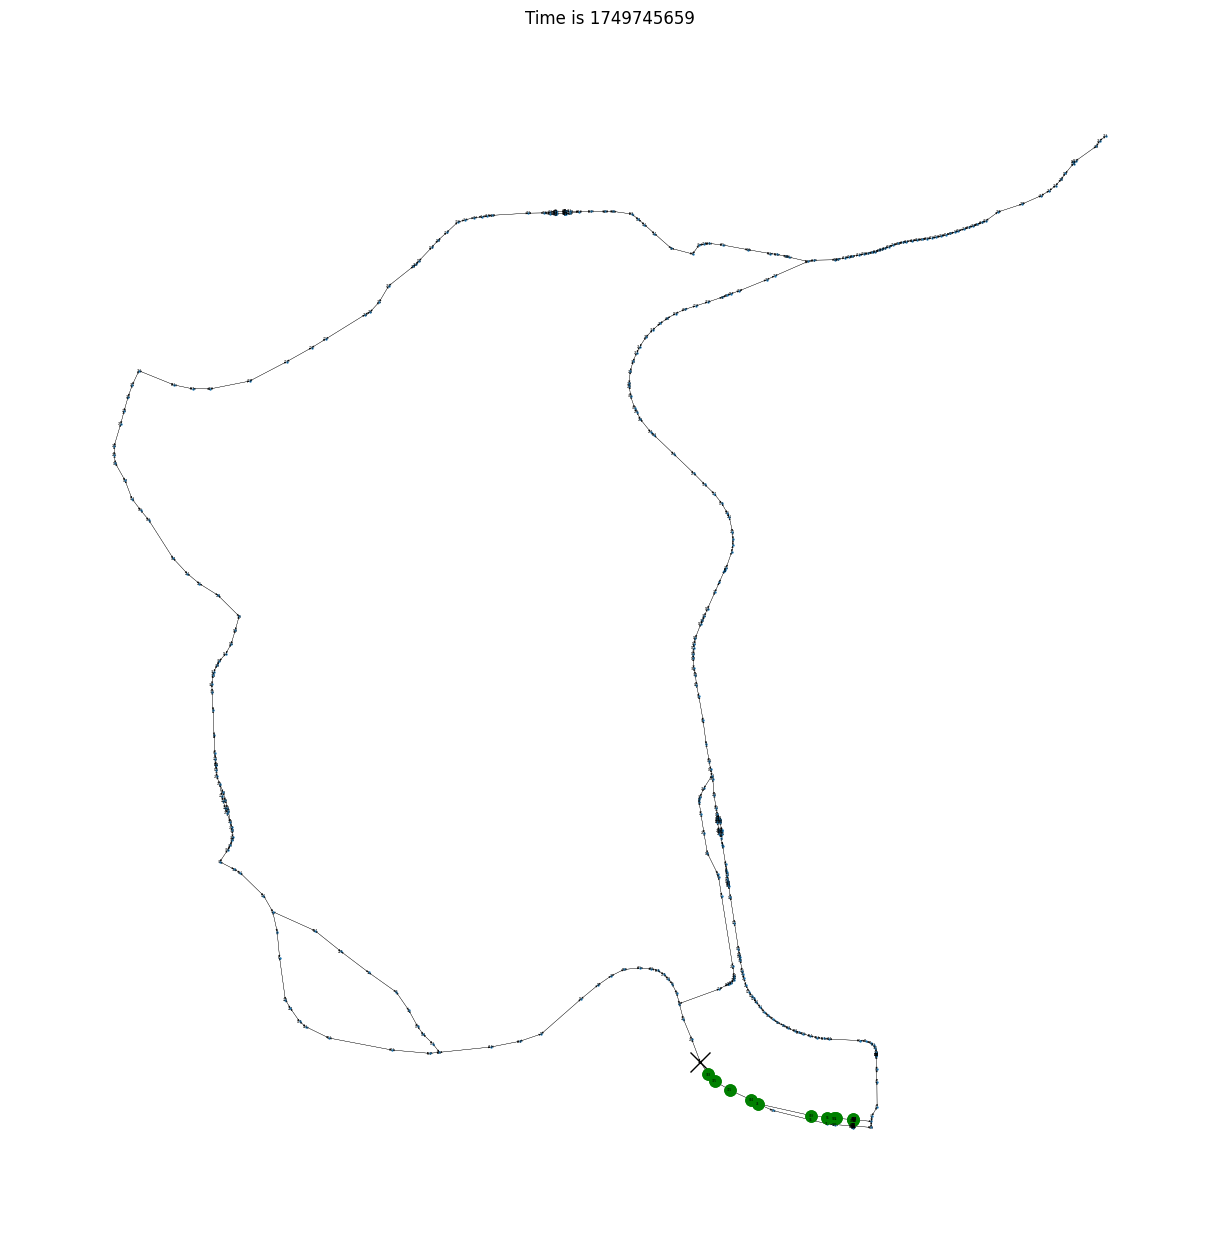
%%time

# Make the animation
fig = plt.figure(figsize=[12, 12])

nx.draw(FG, nx.get_node_attributes(FG, "pos"), with_labels=True, node_size=0.5, font_size=2, width=0.2, arrowsize=3)

(location,) = plt.plot([], [], "ko", markersize=15)
(path,) = plt.plot([], [], "g")
time_text = plt.title("")


def init():
    location.set_data([], [])
    path.set_data([], [])
    time_text.set_text("Time is 0")


def animate(i):
    this_x = [timestamps_x[i]]
    this_y = [timestamps_x[i]]

    location.set_data(this_x, this_y)
    time_text.set_text("Time is {}".format(int(timestamps_t[i])))

    if 0 < i:
        past_x = [x for x in timestamps_x[:i]]
        past_y = [y for y in timestamps_y[:i]]

        path.set_data(past_x, past_y)

        return location, path, time_text

    else:
        return location, time_text


ani = animation.FuncAnimation(fig, animate, np.arange(0, len(timestamps_t)), init_func=init)
ani.save("Example 06 - route - improved.mp4", fps=5, writer='ffmpeg')
CPU times: user 22.5 s, sys: 2 s, total: 24.5 s
Wall time: 21.8 s